
Reading the Health page
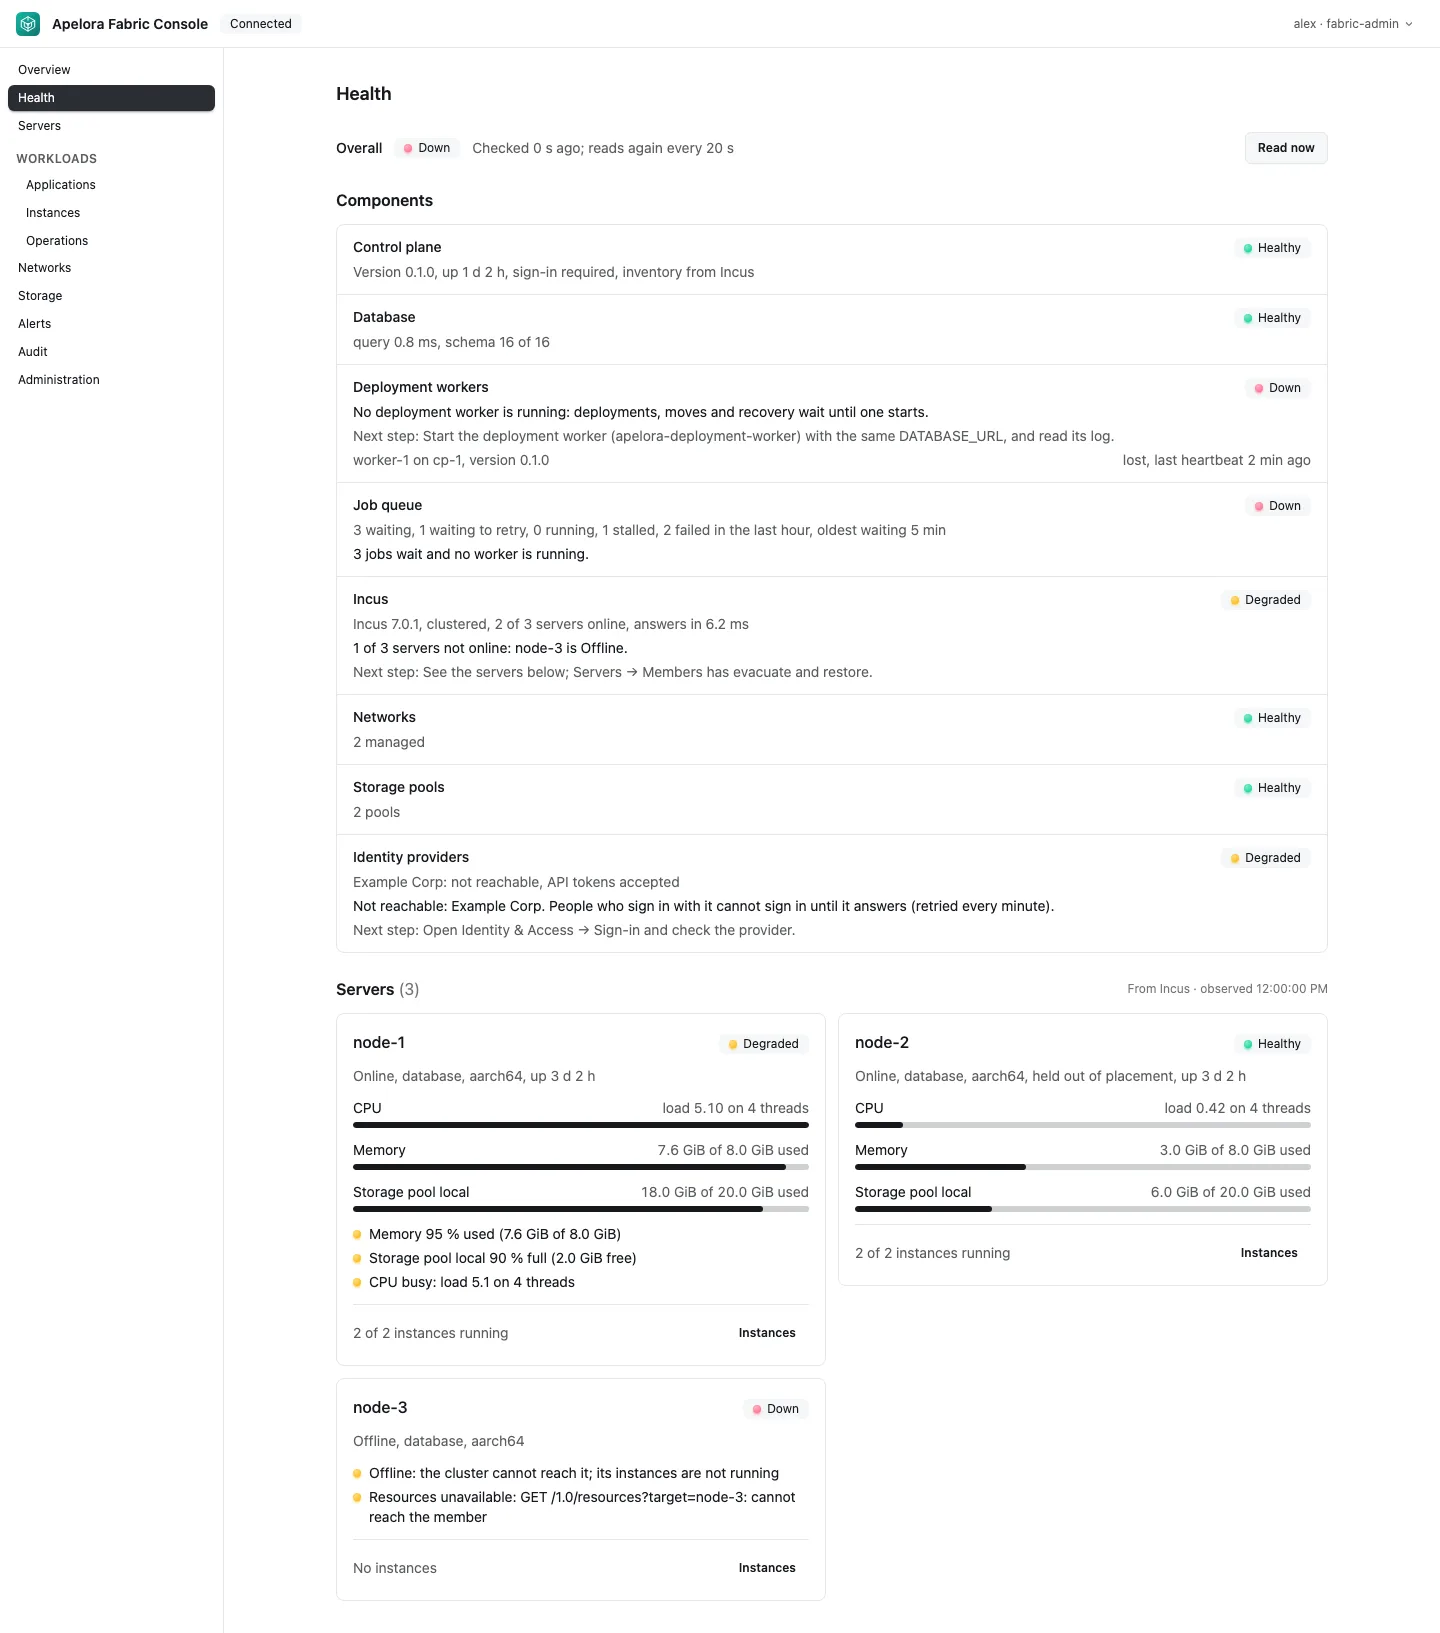
Use the Health page to see what is wrong and where to look first. Open Fabric Console → Health
(needs cluster.view, held by Fabric administrators, Viewers and Auditors at platform level).
The page reads again every 20 seconds while it is visible, and says when it last read. If a read fails, the last figures stay on screen with a notice that says how old they are; nothing is filled in.
States
| Word | Meaning |
|---|---|
| Healthy | Observed and fine |
| Degraded | Works, with a problem worth fixing soon (a server not online, memory above 90 %, a pool above 85 %, an unreachable identity provider, failed jobs) |
| Down | Something does not work for anyone (no worker runs, the database or Incus cannot be reached) |
| Unknown | Could not be observed; never counted as healthy |
| Not set up | Deliberately absent (development mode has no database; mock data has no Incus) |
The overall state is the worst component state; Not set up counts as healthy there.
What to do per row
| Row | Down or degraded because | First checks |
|---|---|---|
| Control plane | Sign-in is off (development mode) | Start it with DATABASE_URL set |
| Database | Not reachable, slow (a trivial query over 500 ms), or the schema is behind this build | DATABASE_URL, PostgreSQL running; restart the control plane (it applies migrations) |
| Deployment workers | No heartbeat within 45 s; a worker lost in the last 10 minutes | Start apelora-deployment-worker with the same DATABASE_URL; read its log (troubleshooting) |
| Job queue | Jobs wait and no worker runs; the oldest waited over 2 min; a job's worker lease expired (stalled); failures in the last hour | Operations page for the jobs and their last error |
| Incus | Not reachable; a server not Online | api-outage, member-failure, Servers → Members for evacuate and restore |
| Networks, Storage pools | Not Created, or missing on a server (OVN networks are exempt: they list only the members present when they were created) | Networks or Storage page; the Incus log on the named server |
| Identity providers | An enabled provider did not answer at the last check (retried every minute) | Identity & Access → Sign-in |
Servers
Each card shows Incus's status, roles, architecture, whether automatic placement is held, and uptime; CPU as load on threads (1-minute load average from Incus), memory and every storage pool as used of total. Warnings come from the server. Instances lists what runs there in the projects Apelora's Incus identity may see; instances in other projects are not shown.
A server whose resources cannot be read within 5 seconds (for example an offline member) says so; its figures are never shown as zero.
Where the numbers come from
| Figure | Source |
|---|---|
| CPU threads, memory used and total | GET /1.0/resources?target=<member> (memory used excludes caches) |
| Load averages, uptime, pool space per member | GET /1.0/cluster/members/<member>/state |
| Worker heartbeats | Table worker_heartbeats (written every 15 s by each worker) |
| Job counts | Table jobs |
| Database round trip and schema | SELECT 1; _sqlx_migrations |
API: GET /api/v1/health/components, GET /api/v1/health/servers. The Studio's capacity
chip uses GET /api/v1/capacity (named servers with cluster.view, numbered ones with
capacity.view). Design: health and capacity.
This page is a copy of docs/runbooks/health-page.md in the repository, which is the source of truth. Suggest a change.